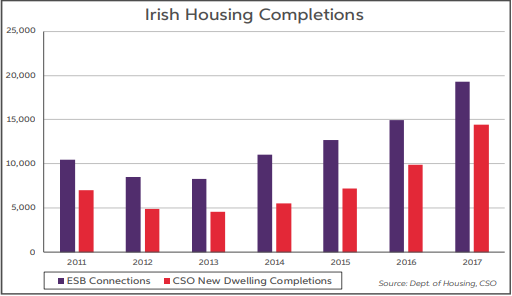
New measurement shows new supply at lower levels than previously estimated.
The Central Statistics Office recently launched a new measure of housing supply.
This was in response to issues relating to the previous ‘completions’ data, complied by the Department of Housing using ESB connections. In recent years, it was considered to be overstating the level of housing supply. The new measure, titled ‘new dwelling completions’, produced by the CSO is still based on ESB connections. However, it takes account of ‘unfinished housing developments’, ‘reconnections’ and ‘non-dwelling’ connections which were overstating the actual level of new supply. Data from other sources are also used in producing a more accurate measure of new supply. The new measurement is a quarterly series, and goes back as far as 2011.
 Based on the new metric, there were 14,446 ‘new dwelling completions’ in 2017 compared to the 19,271 figure from the old methodology. Over the period 2011-17, it appears that the Dept of Housing measurement was overstating supply by 31,576 units (or by 58%). The 14,446 total in 2017 represented a 46% increase on the previous year, which itself was a 37% rise on 2016 levels. In the first quarter of 2018, new completions were at 3,526 units. This is a 26.9% increase on the same period in 2017. So while the new measurement shows that the level of house-building is lower than previously envisaged, nonetheless, it indicates that supply is on a strong upward trajectory.
Housing Starts & Housing Registrations
Other measurements of building activity have been more mixed recently, with the severe weather in March impacting activity. Housing starts (measured using commencement notices) were up 15% on a year to date basis in April. Commencements rose by 33% in 2017. Meantime, housing registrations, which tend to reflect developer activity, have been essentially flat over the last 12 months. In terms of survey data, the housing component of the construction PMI offers encouragement, with the index rising to a one-year high in May, at 65.2, suggesting a pick-up in home-building activity.
Crucially though, while the supply situation is showing signs of improvement, the level of building activity remains well below the projected 33,000 units that are required per annum to meet estimated housing demand. Even if the current growth trend in supply is maintained, it is likely to be 2021, at the earliest, before new house building reaches the level of estimated annual demand. Furthermore, the issue of pent-up demand that has been accumulating in recent years has also to be factored in. The new completions data indicate that this pent-up demand is now larger than previously estimated. Overall, it is likely to be well into the next decade before supply and demand are more closely aligned in the Irish residential property market.
Reacceleration in house price growth
The latest CSO house price data show that house price inflation has continued to pick up in pace. Nationally, prices rose by 13% in year-on-year terms in April. This compares to a rate of 12% at end 2017 and 9.5% in April 2017. The pattern of non-Dublin prices outpacing Dublin has generally continued in the opening months of 2018. Outside of Dublin prices rose by 13.6% y/y in April, compared to a 12.5% increase in the Capital. Despite the sustained strong increases, prices are still 21% below their peak levels. Meanwhile, rents are now 22% above their previous peak, and the rate of growth has re-accelerated in 2018.
Some loss of momentum in mortgage lending growth The strong growth seen in mortgage lending in recent years appears to be losing some momentum. The level of mortgage approvals nationally has stagnated just below 37,000 on a 12-month cumulative basis. Meanwhile, the growth in the number of mortgage drawdowns has continued to slow, at 9.6% y/y in Q1 (vs. 26% in Q1’17). It may be that Central Bank mortgage lending rules are impacting the market, especially in Dublin, where potential buyers can find it difficult to get sufficient mortgage finance given the relatively low loan-to-income ratio (3.5 times) in the lending regulations.
Full report available on : Housing Market Bulletin June 2018


